Muscle Endurance: Part 1- Muscle increase

Purpose: Exercise has been linked to many positive benefits in a person's life. It is known that certain exercises will increase the endurance of a muscle. Scientific AmeriKen, will probe into the exercise world to see how to generalize this rate of increase.
Hypothesis: There are three types of graphs in which to generalize the rate. The first is a linear graph, where the rate remains steady as time continues, and exponential graph, where rate increase as time continues, and a logarithmic graph, where the rate will decrease as time continues. The Hypothesis of this experiment is that, the rate of muscle endurance, with constant exercise, will decrease as time continues, and therefore can be generalized as a logarithmic graph.
Equipment: Pen and Paper, other equipment is optional pertaining to type of exercise or muscle that is used. Used for this experiment was a weight set.
Procedure: This experiment used a weight set, therefore, the procedure was to see how many repetitions one could do per sitting, and recording results. That process was repeated over a period of almost 2 months.
Observations:
IMAGE LOST
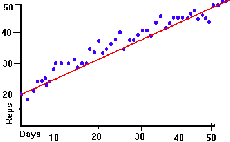
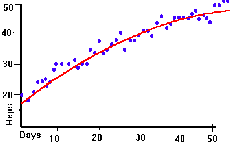
Above: The Graph represents raw data from the experiment. Below: Graphical interpretations of the rate of the increase in repetitions. The left graph represents linear progression, the graph on the right represents logarithmic progression.
 |
 |
Conclusion: From the date, it is apparent that the best fitting line is the line which represents logarithmic progression. Stated in other words, the rate of increase, in the number of repetitions will decrease as time continues.