
Self Esteem and Computer Use
Purpose: Self-esteem is the measurement of one's confiedence and how one percieves themself. This week, Scientific AmeriKen will enter the mind of those who partake in Computer chat programs and measure self esteem to see if there is any correlation between such activity and self-esteem.
Hypothesis: It is the hypothesis of this experiment that the esteem of computer chatters will be lower then that of the control group. The Basis of this hypothesis is that it requires less confiedence to talk on an internet chat program.This fact will attract people who lack esteem to use computers, and sway the general distrubtion of self-esteem more towards having a slight lack of self-esteem.
Equipment: This experiment will require a self-esteem tester. Used for this experiment was the ISE (Index of Self-Esteem). {Click here to view test form}. Also required is computer with inet access and a chat program, Pen and Paper and a calculator is optional.
Procedure: The first step is to gather participants. Distribute the test, and allow the participants time to complete and return to you. Inform the participants that their anonymity will be protected, and that all files will be renamed, (ie test1.txt, test2.txt, test3... ...) The next step is to add results. In the case of the ISE, several of the scores are reversed, (problems 3-7, 14,15,18,21,23 & 25). After reversal, all scores are added up, and 25 is subtracted from it's total to achieve the self-esteem rating. Average the results. Repeat this process with ordinary people, by handing out the ISE test, and maintaining their anonymity. Compare results.
Observations: The ISE has several things that must be noted. The first is that it is reverse scored, that is, lower scores mean higher self-esteem. Also, the ISE gives a median score of 30, representing the point that scores above 30 mean that the participant has a clinically significant problem.
Chart Missing |
The Chart on left shows the natural distribution of participants and scores. The X-axis represents the scores ranging from 1-75 on the ISE. The Red line represents the Natural Distribution of Computer Chat users, while the blue line represents a mostly college age non-computer group. |
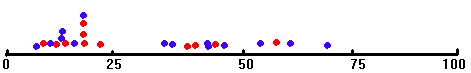 |
| The above chart represents the number line distribution of the scores, with each dot representing one specific participant's score. Blue dots represent computer chatroom users while red dots represent college aged non-computer participants. |
| Type: | Top Score: | Lowest Score: | Average Score: |
| College Aged Non-Computer Chat Room Users | 58 | 13 | 28.1 |
| Computer Chat Room Users | 70 | 12 | 34.6 |
Conclusion: In this experiment, the hypothesis was proven true and computer chat room users have on average lower self-esteem. Unfortuantly for the hypothesis, the numbers of participants is quite low, which yields rather varied and unreliable results. An interesting outcome of the experiment is the varied range of scores for Computer chat users. Judging by the number line graph, most of the participants fall on the extreams away from the median point, which shows that the make up of the computer chatter is half with too much self esteem and half with not enough. Overall, for the sake of argument, however, the hypothesis is proven true.