most environmental researchers agree with the premise that man is responsible for global warming the issue still remains as to who is to blame - nature or man? Scientific AmeriKen jumps on this case to track down and find who exactly is responsible!

Scientific AmeriKen will attempt to answer two questions - the first is who is to blame. The project focuses on cities around the United States. The hypothesis of this experiment is that if mankind is to blame for global warming then the largest source of the warming (suggested to be the US) should be experiencing greater warming than the world average. By extending this logic a second question arises which would be assuming the United States is warming the world then which city is responsible for it? Based on population it is hypothesized that New York City would have the largest increase in annual temperature.

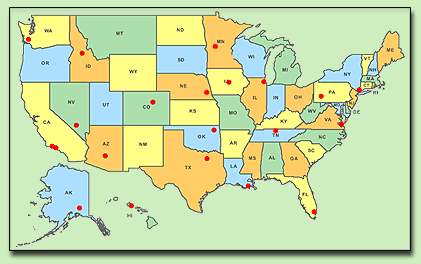
To compare global warming data for the United States and its individual cities, Scientific AmeriKen looked analyze annual average daily temperatures over an extended period of time.  Though the data was difficult to obtain once source presented itself with a cornucopia of data - the Farmer's Almanac (Weather history - http://www.almanac.com/weatherhistory/). In total 21 cities were analyzed (indicated as red dots on figure at left) - where average daily temperature was recovered from the database for each year from 1940 to 2007. Each year was then tallied up and averaged from the 21 cities to generate the average daily temperatures for the United States. Temperature anomaly was derived by averaging the daily temperature for all years then subtracting this value from each individual year. 5 year moving average mean was derived by averaging the two previous and two following years for each year. The data for the United States shows a general warming trend that starts in 1968. Determination of which city contributes the most to global warming was performed by taking the area underneath each city plot between 1968-2007 and subtracting the area underneath the plot of the United States. This value, when divided by the number of years (40) yields the warming trend per year. Though the data was difficult to obtain once source presented itself with a cornucopia of data - the Farmer's Almanac (Weather history - http://www.almanac.com/weatherhistory/). In total 21 cities were analyzed (indicated as red dots on figure at left) - where average daily temperature was recovered from the database for each year from 1940 to 2007. Each year was then tallied up and averaged from the 21 cities to generate the average daily temperatures for the United States. Temperature anomaly was derived by averaging the daily temperature for all years then subtracting this value from each individual year. 5 year moving average mean was derived by averaging the two previous and two following years for each year. The data for the United States shows a general warming trend that starts in 1968. Determination of which city contributes the most to global warming was performed by taking the area underneath each city plot between 1968-2007 and subtracting the area underneath the plot of the United States. This value, when divided by the number of years (40) yields the warming trend per year.

These data yield several surprises as seen in the figure below. Please use the forward/back buttons or menu to view individual city data.
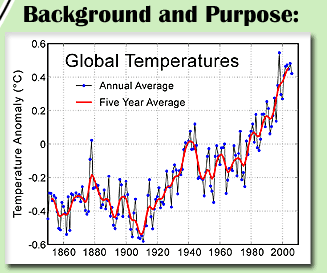
Judging by the temperature anomaly data for the United States as a whole it appears to nearly mirror the trend seen for the earth. Interestingly, the larger warming event is preceded by a strong cooling event which some believed was an oncoming ice age (link). Analysis of the cities identified Phoenix as the leading cause of global warming - although it could be argued that its increasing temperatures are the effect of global warming and not the cause. It is also noted that the larger cities tended to have the larger warming trends which would favor arguments that the activity of mankind contributes to global warming although there are too few large cities analyzed to support the notion. are the effect of global warming and not the cause. It is also noted that the larger cities tended to have the larger warming trends which would favor arguments that the activity of mankind contributes to global warming although there are too few large cities analyzed to support the notion.
Click here to download raw data.

These data support the notion that global warming is occurring. With regards to who is to blame for it happening - it was the hypothesis of this experiment that if mankind was responsible then one of the largest consumers, the United States, would have larger warming trends than the world average. The data indicate that in fact the United States is in line with the global average suggesting Mankind is not to blame. It has been suggested that carbon dioxide production, thought to be one cause of GW, may disperse quickly in the atmosphere explaining why the United States would not have a larger trend than the world. Although plausible, a simpler explanation may simply be that warming and cooling cycles are normal for the earth. One additional note when dealing with anomaly data. This data presents the difference between the given year and the average for that time period - thus it can't be determined whether the time period is normal going to global warming or if it is global cooling going to normal. Finally, as the data suggest that mankind has little effect on global warming which would imply that mankind has little ability to stop global warming. Despite this and seeing the need to rescue the poor penguins on the melting icebergs, Scientific AmeriKen encourages all donations to help the fight!
This experiment is dedicated in the memory of my friend Shelly Walsh - one of the fiercest Its Your Turn Jamble players I've ever had the good fortune to play against. Always a good friend, always good advice and will always be missed. |


 Though the data was difficult to obtain once source presented itself with a cornucopia of data - the Farmer's Almanac (Weather history -