 |

SKITTLES:
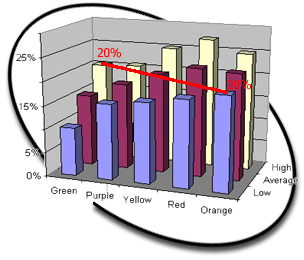
A total of 589 Skittles were counted. The following results were totaled: 135 Red, 132 Orange, 124 Yellow, 108 Purple, 90 Green. The results were averaged and standard deviation was used to give high and low ranges as graphed below.
 The graph on the right shows the average distribution of Skittles over 10 packs. The middle row indicates the difference in average between the different colors. The average of the most common color, Orange was 22% (S.D. = 2.5%) per pack vs the least common Green at 15% (S.D. = 5%) per pack. The results indicate that despite the large difference in averages, the range created from standard deviation causes overlap between all colors (indicated line in graph) and therefore Skittles are randomly distributed. The graph on the right shows the average distribution of Skittles over 10 packs. The middle row indicates the difference in average between the different colors. The average of the most common color, Orange was 22% (S.D. = 2.5%) per pack vs the least common Green at 15% (S.D. = 5%) per pack. The results indicate that despite the large difference in averages, the range created from standard deviation causes overlap between all colors (indicated line in graph) and therefore Skittles are randomly distributed.
M&Ms:
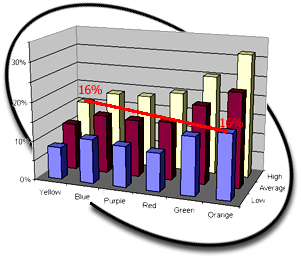
A total of 808 M&Ms were counted (5 from King-size packs, 5 from regular packs). The following results were totaled: 179 orange, 168 green, 126 red, 121 blue, 118 purple, 96 yellow. The results were also averaged and standard deviation was used to give high and low ranges as graphed below.
 The graph on the right shows the average distribution of M&Ms over 10 packs. The middle row indicates the difference in average between the different colors. The average of the most common color, Orange was 24% (S.D. = 7.5%) per pack vs the least common Yellow at 12% (S.D. = 3.6%) per pack. The results indicate that, again, despite the large difference in averages, the range created from standard deviation causes overlap between all colors (indicated line in graph) and therefore M&Ms are randomly distributed. The graph on the right shows the average distribution of M&Ms over 10 packs. The middle row indicates the difference in average between the different colors. The average of the most common color, Orange was 24% (S.D. = 7.5%) per pack vs the least common Yellow at 12% (S.D. = 3.6%) per pack. The results indicate that, again, despite the large difference in averages, the range created from standard deviation causes overlap between all colors (indicated line in graph) and therefore M&Ms are randomly distributed.
Introduction & Materials and Methods | Results | Discussion | Additional Information
|
 |
